
I decided to look back and analyze price growth patterns in the US market.
Naturally, I took SUVs as one of the best-selling classes which attracts more and more buyers each year.
Thanks to KelleyBlueBook, I didn't need to analyze all SUVs' sales, I just took 10 best-selling vehicles in this class in 2023 for my research.
And here's what I found during my investigation:
- Between 2000 and 2024, SUVs became 43.2% more expensive, on average.
- 10 Best-selling SUVs took 17.5% of entire car market in 2023.
- Between 2020 and 2024, SUVs added about 9% to their prices.
- Taking inflation into account, SUVs are now almost 20% cheaper than in the year 2000, on average.
Quick guides on how I did the research
First of all, I used Wiki articles like this one to get information on sales in the US. I only took US sales and ignored any other markets to make the research as clear as possible.
After that, I googled MSRP prices for chosen cars in certain years. I took several milestones: 2000, 2005, 2010, 2015, 2020, and 2024.
Usually, my search gave me results in the snippet, but I proceeded and verified that the result was adequate. So, each MSRP price I took down was checked in at the last 3 sources. Among my sources for this are KBB, CarAndDriver, Edmunds, and also official websites of car manufacturers.
After this search, I had MSRP prices in different years for all of my cars. And I made several types of calculations you may find intriguing.
Let's see them!
Cars and sales figures
So, for this research, I took 10 best-selling SUVs in the US in 2023:
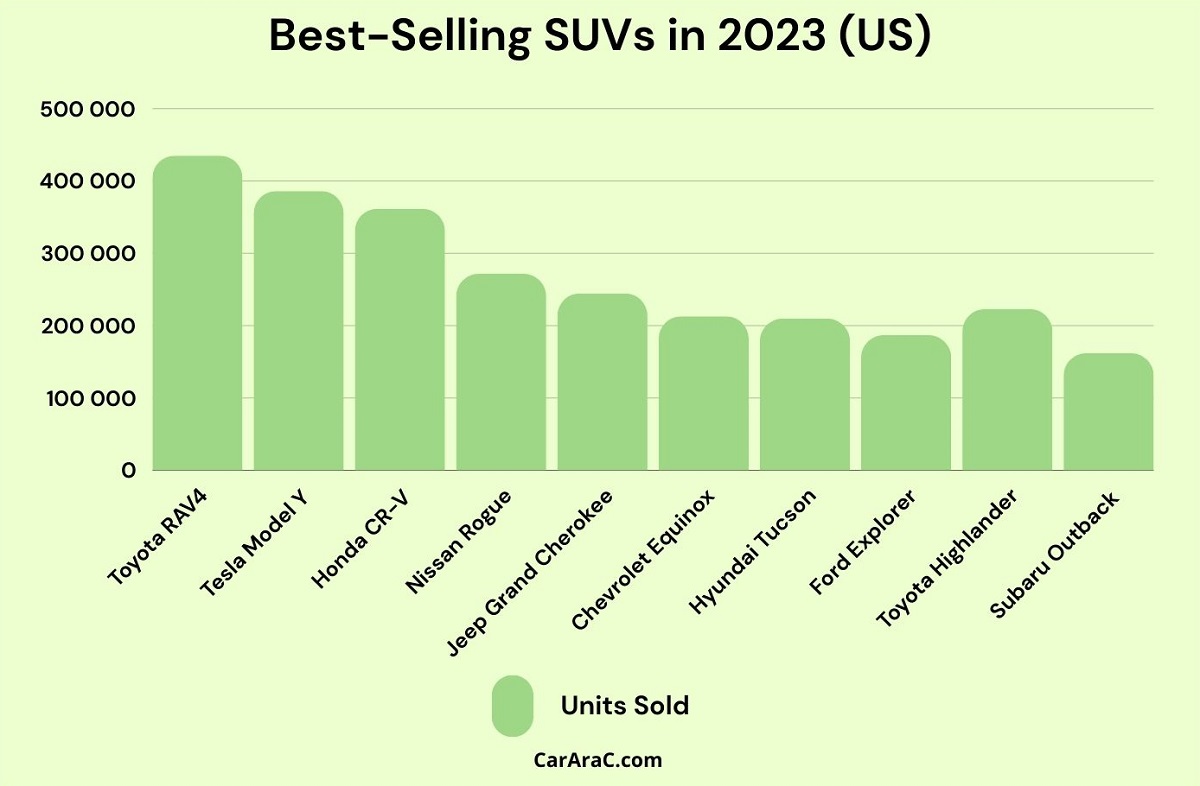
Here's the text version in case you need this:
- Toyota RAV4 (435,000 sales)
- Tesla Model Y (385,900 sales)
- Honda CR-V (361,500 sales)
- Nissan Rogue (271,500 sales)
- Jeep Grand Cherokee (244,600 sales)
- Toyota Highlander (222,800 sales)
- Chevrolet Equinox (212,700 sales)
- Hyundai Tucson (209,600 sales)
- Ford Explorer (186,800 sales)
- Subaru Outback (161,800 sales)
Naturally, not all of them have been sold since the year 2000, so data for some years are not complete.
Interestingly, in 2023, these vehicles altogether sold 2.7 million units and this is 17.5% of the entire market of new cars (which was 15.6 million vehicles in 2023)
On average, each of these SUVs sold 270,000 units in 2023 and the leader, the Toyota RAV4 achieved its history best 435,000 sales.
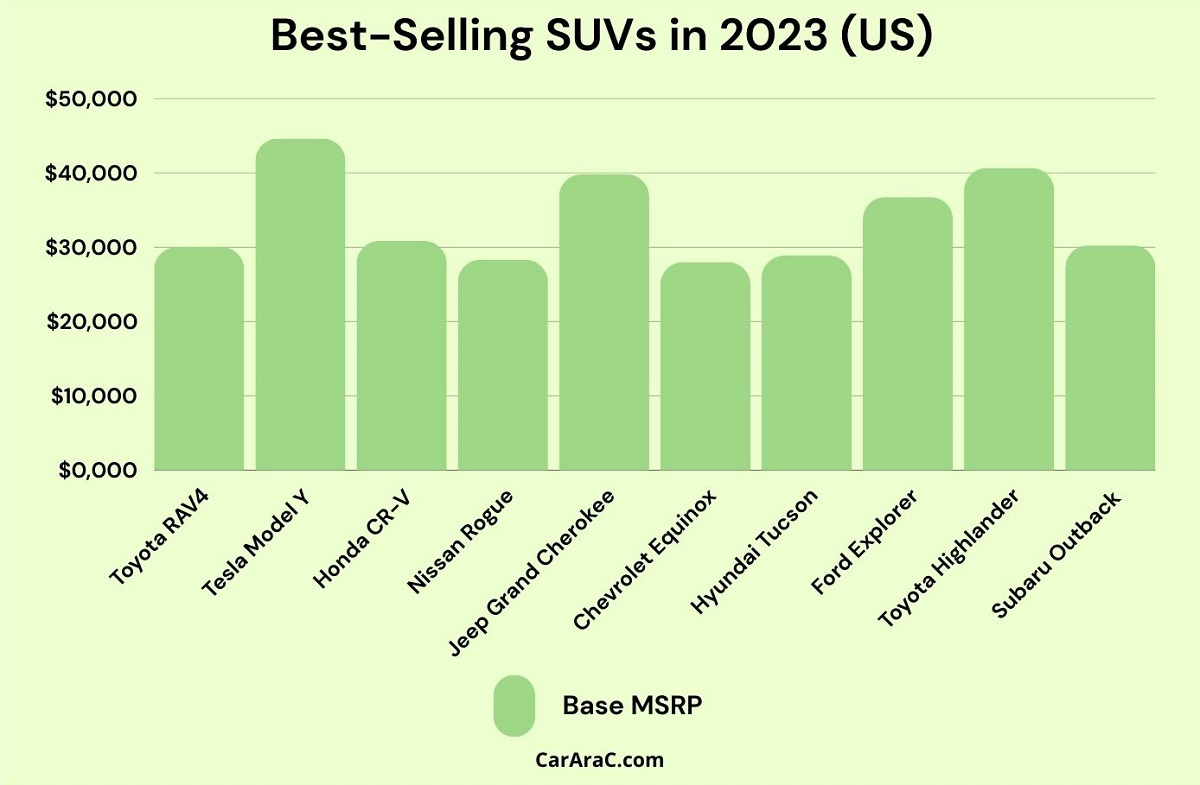
Average price growth from 2020 to 2024
After taking down all the prices for the milestone years (the table is given below), I counted the average price for all these 10 SUVs in the given year. Here's what I found:
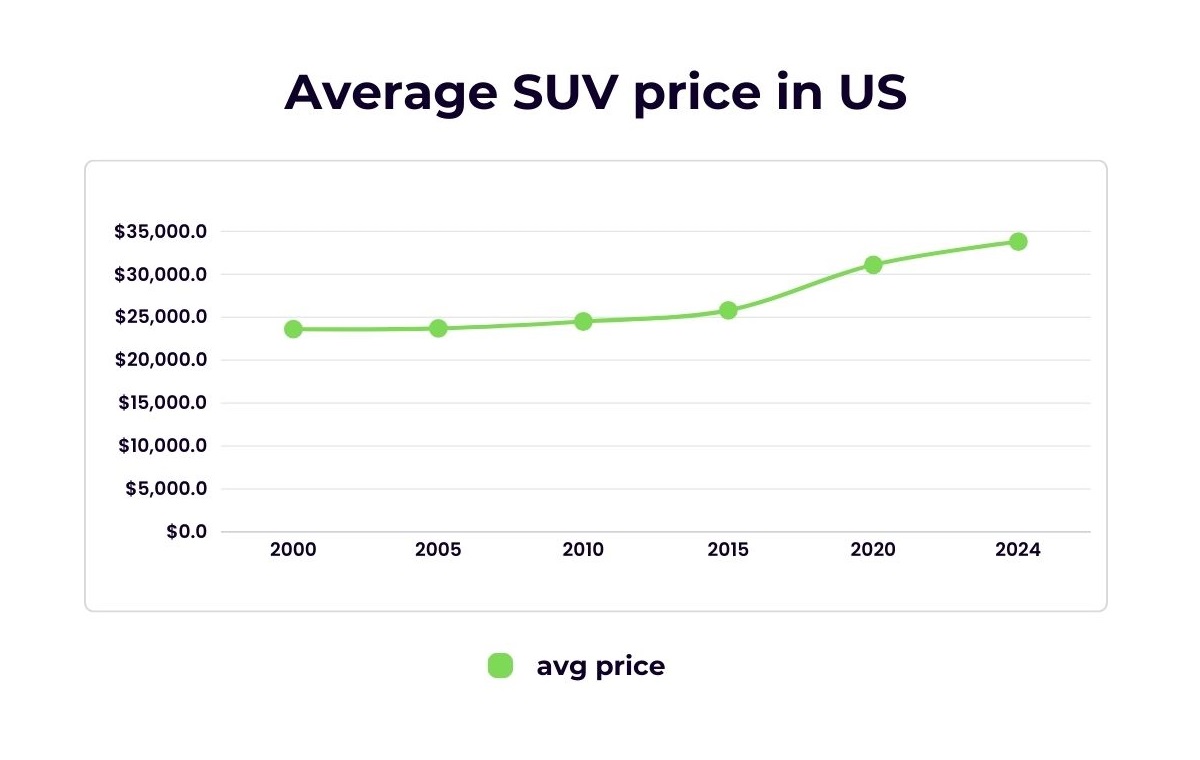
Here's the text version in case you need this:
- 2000 - $23,600;
- 2005 - $23,700 (+0.4%);
- 2010 - $24,500 (+3.4%);
- 2015 - $25,800 (+5.3%);
- 2020 - $31,100 (+20.5%);
- 2024 - $33,800 (+8.7%).
So, we see that the price growth was tremendous between 2015 and 2020 adding over 20% to the average price of these 10 vehicles.
We should also understand that the Model Y SUV appeared in 2020 making its impact on the average price and being more expensive than any other unit in the research. If we exclude the Model Y, we'll get about 11% growth which is still the highest result in the research.
Within the previous 4 years, SUVs added almost 9% to their prices.
From 2000 to 2024, SUVs became 43.2% more expensive.
Every model explained in detail
Now, it's time to move to the final part of the research and open up all the stats that I used for it. Obviously, we see the price growth trends but don't jump to conclusions because the comparison with the inflation rates will surprise you.
So, here's how prices changed for each SUV model from 2000 to 2024 (or from the year of its launch to 2024):
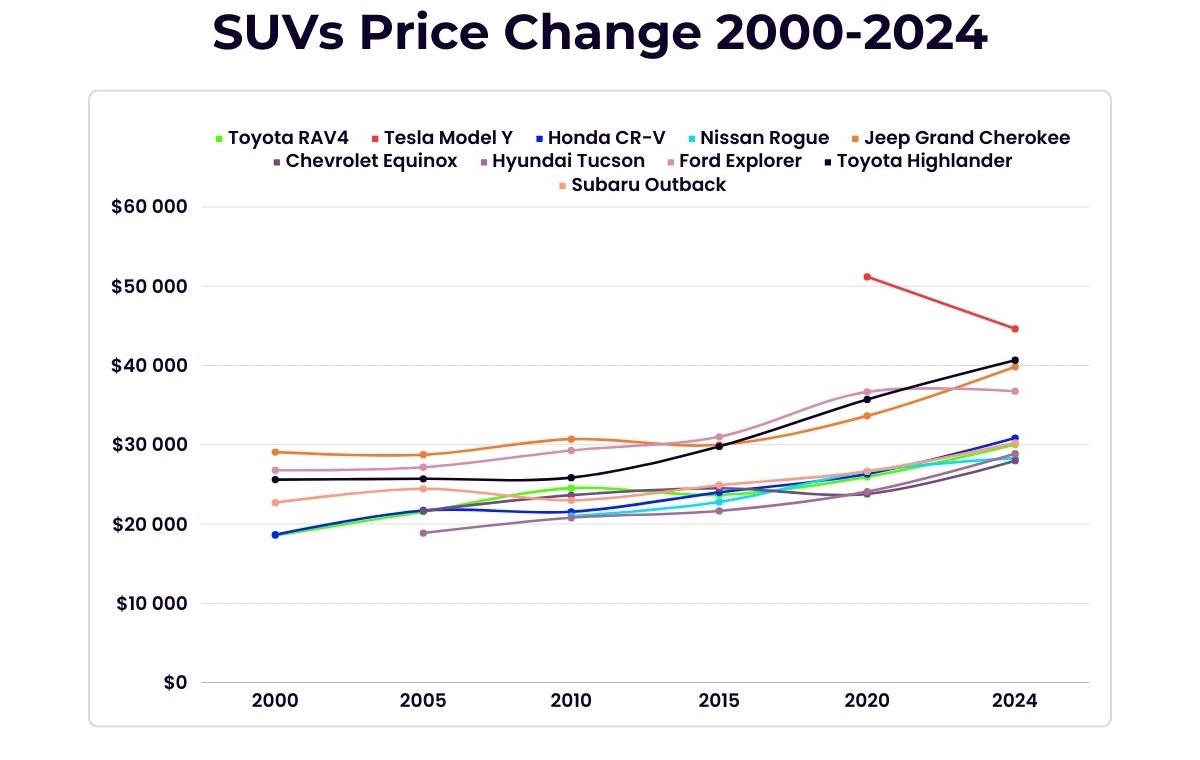
We see that the Honda CR-V is the leader having gained over 65% of its initial price in the year 2000.
Tesla Model Y dropped the price by 12.8% within the 2020-2024 period. But this is due to trim changes rather than actual price reductions.
Taking into account just fuel-driven SUVs, the Chevy Equinox appeared to be one of the most stable in terms of price. It gained 29% from 2005 to 2024.
Here's the table for further investigation:
|
SUV |
Price 2000 |
Price 2005 |
Price 2010 |
Price 2015 |
Price 2020 |
Price 2024 |
Price growth 2000-2024 |
|
Toyota RAV4 |
$18,558 |
$21,565 |
$24,533 |
$23,680 |
$25,950 |
$30,025 |
+61.8% |
|
Tesla Model Y |
--- |
--- |
--- |
--- |
$51,190 |
$44,630 |
-12.8% |
|
Honda CR-V |
$18,650 |
$21,710 |
$21,545 |
$24,000 |
$26,325 |
$30,850 |
+65.4% |
|
Nissan Rogue |
--- |
--- |
$21,000 |
$22,790 |
$26,640 |
$28,320 |
+34.9% |
|
Jeep Grand Cherokee |
$29,075 |
$28,745 |
$30,710 |
$29,995 |
$33,645 |
$39,830 |
+37.0% |
|
Chevrolet Equinox |
--- |
$21,660 |
$23,645 |
$24,520 |
$23,800 |
$27,995 |
+29.2% |
|
Hyundai Tucson |
--- |
$18,864 |
$20,790 |
$21,650 |
$24,090 |
$28,875 |
+53.1% |
|
Ford Explorer |
$26,790 |
$27,165 |
$29,280 |
$31,000 |
$36,675 |
$36,760 |
+37.2% |
|
Toyota Highlander |
$25,605 |
$25,705 |
$25,855 |
$29,795 |
$35,720 |
$40,665 |
+58.8% |
|
Subaru Outback |
$22,695 |
$24,445 |
$22,995 |
$24,895 |
$26,645 |
$30,240 |
+33.3% |
What if we count inflation?
According to the Federal Reserved Bank of Minneapolis, the inflation between 2000 and 2024 was 77%. Here's how USD has been losing its buying power from 2000 to 2024:
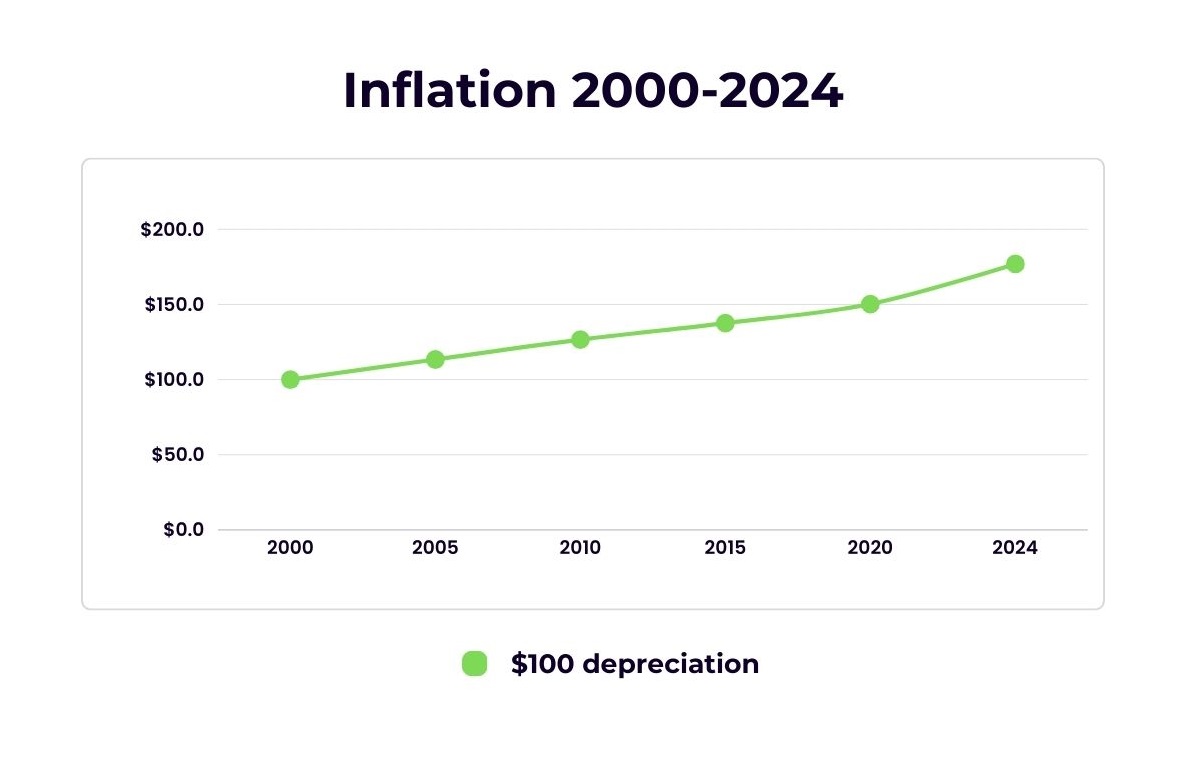
According to this, the Toyota RAV4 which used to cost $18,558 back in 2000, should now cost about $32,847, according to inflation. But it costs $30,025 in dealerships, so the price even dropped a little.
Here's the graph showing the relation between the expected inflation-corrected price of SUVs in 2024 and the actual price in dealerships:
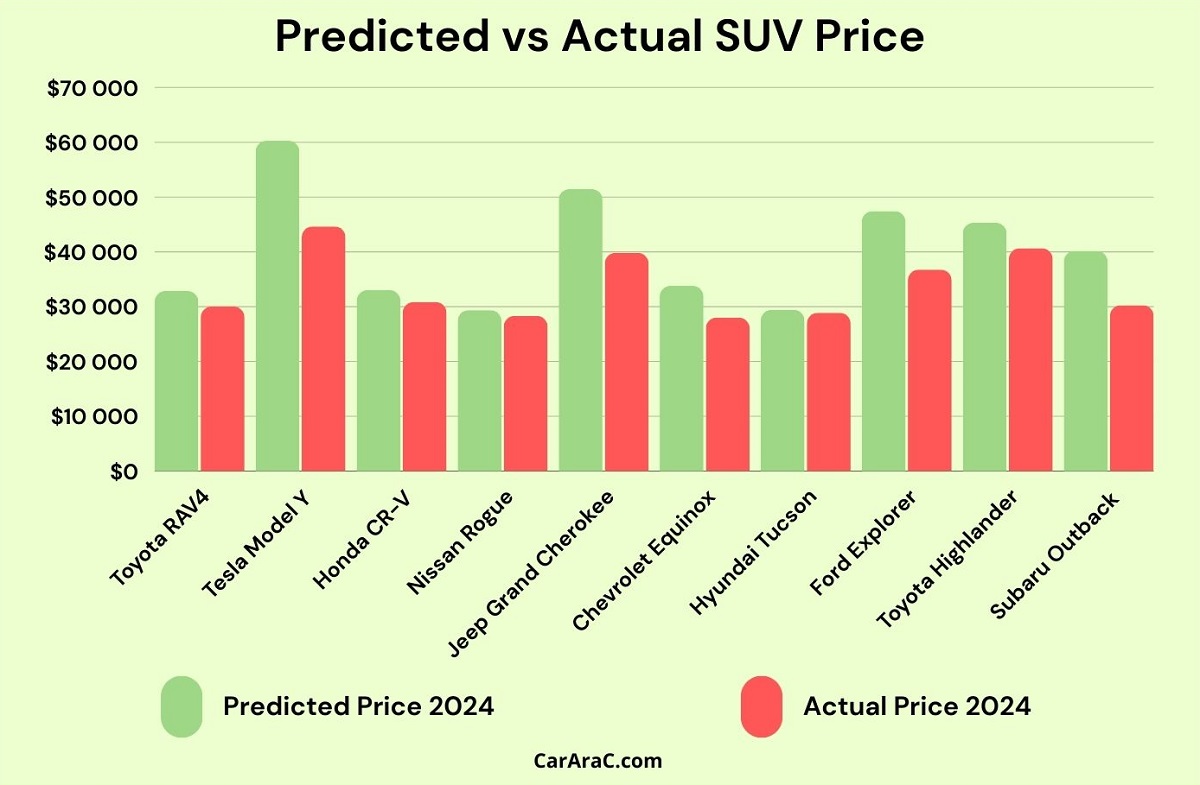
The green bar here shows the calculated price based on 2000 SUV prices and inflation - this is what these SUVs cost in 2000 for today's money. The red bat is the actual price of the SUV on the market today.
Now we see that the Nissan Rogue and Hyundai Tucson are the closest to their inflation-backed prices now. While Tesla Model Y, Jeep Grand Cherokee, and Subaru Outback have the biggest difference.
And we may conclude that not a single vehicle actually gained price within these 24 years if we calculate the inflation-corrected prices.
About the authors
The CarAraC research team is composed of seasoned auto mechanics and automotive industry professionals, including individuals with advanced degrees and certifications in their field. Our team members boast prestigious credentials, reflecting their extensive knowledge and skills. These qualifications include: IMI: Institute of the Motor Industry, ASE-Certified Master Automobile Technicians; Coventry University, Graduate of MA in Automotive Journalism; Politecnico di Torino, Italy, MS Automotive Engineering; Ss. Cyril and Methodius University in Skopje, Mechanical University in Skopje; TOC Automotive College; DHA Suffa University, Department of Mechanical Engineering


Add comment