
For this research, we took open stats showing sales of the three most popular pickup trucks in the US - Ford F-150, Ram Truck, and Chevrolet Silverado (GMC Sierra).
Representing Ford, Stellantis, and GM, these trucks are the symbols of competition in the American car market and we've managed to learn several insights from this research:
- Altogether, F-150, Silverado, and Ram Truck sold, on average 1,700,000 trucks a year, within the 2003-2023 period.
- Ford F-Series is a leader among the trucks and has not been beaten by any other model within 20 years.
- Ford F-Series, Silverado, and Ram Truck formed, on average, 10.9% of all car sales, within this period.
- 4.82% of all new cars sold in the US between 2003 and 2023 were Ford F-Series trucks.
Now, let's dive into the figures and see where we took these data from.
What are the information sources?
We used the recent report by the Goodcarbadcar website to find three of the most popular light trucks on the market in 2023.
After that, we took Wiki data for the Ford F-150, Ram Pickup Truck, and also Chevy Silverado in terms of US sales.
The research embraces the period from 2003 to 2023.
Disclaimer: We understand that the sales stats include not just the F-150 sales but the F-Series sales. Also, Ram 1500 stats include all Ram Pickup Truck sales. Unfortunately, there is no way we could separate the data and take exclusively the stats for light trucks.
Disclaimer 2: We only took US sales stats ignoring other markets.
Ford F-Series, Ram Truck, and Silverado sold 2.3 million vehicles altogether within 20 years
Here's what the comparative sale chart looks like for these three truck models:
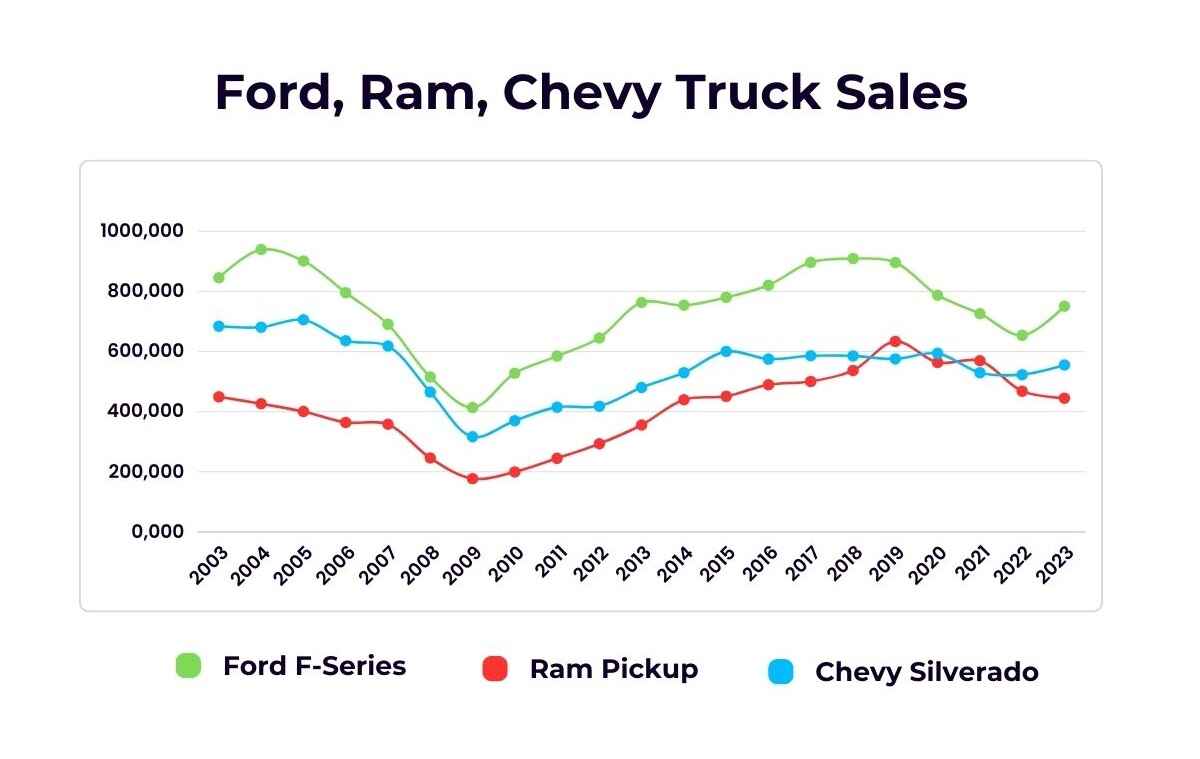
Here, we can see that Ford F-Series trucks have been dominating the market for all 20 years that our research embraces.
Chevy Silverado comes in second place and there were only two years when Ram Pickup Truck overperformed it - 2019 and 2021.
Also, we can clearly see two crisis years within the research period. It's 2004-2009 when sales were going down year by year. And 2019-2022 with the same trend in post-COVID times.
The peak year for each truck was different:
- Ford F-Series: 2004with almost 940,000 sales;
- Ram Pickup: 2019with 633,000 sales;
- Chevy Silverado: 2005with 706,000 sales.
Interestingly, Ford sold, on average 742,800 F-Series trucks a year within this 20-year period. Ram averaged 410,200 sales a year of Pickup Trucks, while Chevy sold about 545,000 Silverados a year.
Full-Size Truck Sales in the US 2003-2023:
|
Year |
Ford F-Series |
Ram Pickup |
Chevy Silverado |
|
2003 |
845,600 |
449,400 |
684,300 |
|
2004 |
939,500 |
426,300 |
680,800 |
|
2005 |
901,500 |
400,500 |
706,000 |
|
2006 |
796,000 |
364,200 |
636,100 |
|
2007 |
690,600 |
358,300 |
618,300 |
|
2008 |
515,500 |
245,800 |
465,100 |
|
2009 |
413,600 |
177,300 |
316,600 |
|
2010 |
528,300 |
199,700 |
370,100 |
|
2011 |
584,900 |
244,800 |
415,100 |
|
2012 |
645,300 |
293,400 |
418,300 |
|
2013 |
763,400 |
355,700 |
480,400 |
|
2014 |
753,900 |
439,800 |
529,800 |
|
2015 |
780,400 |
451,100 |
600,600 |
|
2016 |
820,800 |
489,400 |
574,900 |
|
2017 |
896,800 |
500,700 |
585,900 |
|
2018 |
909,300 |
537,000 |
585,600 |
|
2019 |
896,500 |
633,700 |
575,600 |
|
2020 |
787,400 |
563,700 |
594,100 |
|
2021 |
726,000 |
569,400 |
529,800 |
|
2022 |
654,000 |
468,300 |
523,200 |
|
2023 |
750,800 |
445,000 |
555,100 |
4.82% of all car sales between 2003 and 2023 are Ford F-Series trucks
Also, we looked at overall new car sales in the US to understand the market trends. For this, we got the data from the Bureau of Transportation Statistics.
Here's what new car sales looked like within the research period:
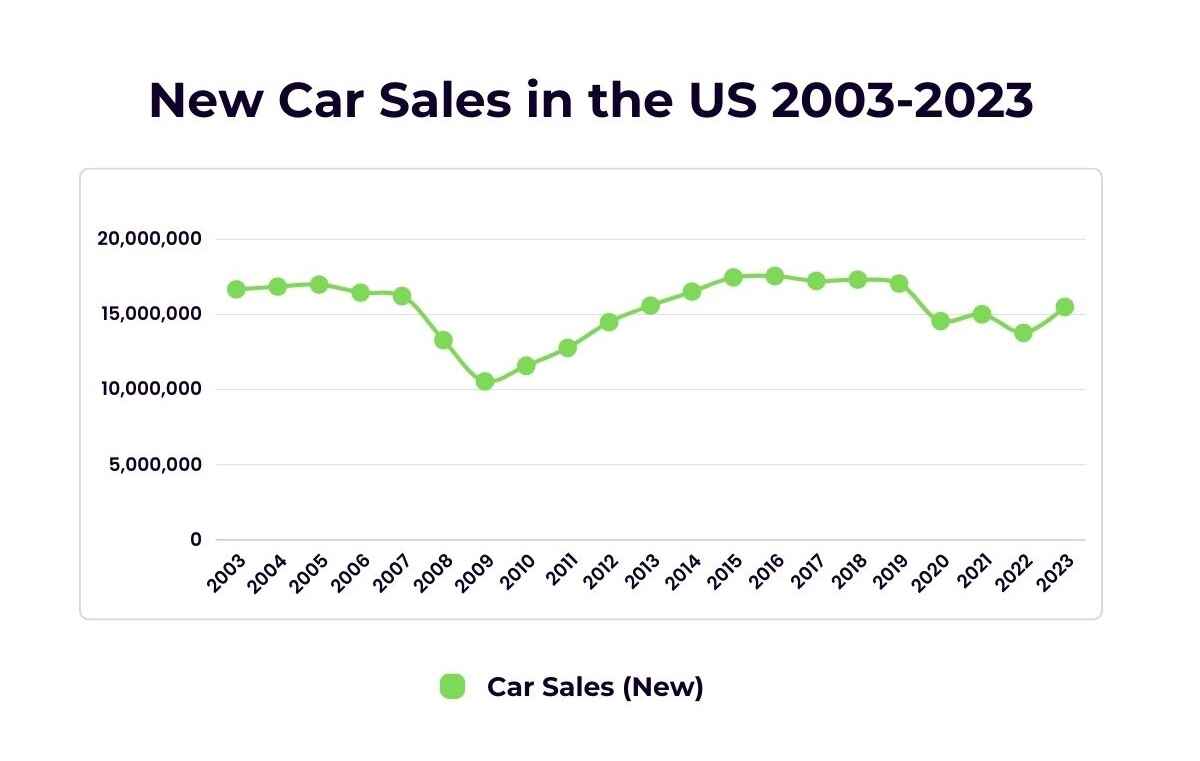
We can see that the truck chart and new car sales chart repeat the same trends, so the ups and downs in sales were mostly connected to economic issues rather than to certain truck popularity or pickup-truck sales trends.
All New Car Sales in the US 2003-2023:
|
Year |
New Car Sales |
|
2003 |
16,670,000 |
|
2004 |
16,850,000 |
|
2005 |
16,990,000 |
|
2006 |
16,460,000 |
|
2007 |
16,230,000 |
|
2008 |
13,300,000 |
|
2009 |
10,550,000 |
|
2010 |
11,589,000 |
|
2011 |
12,778,000 |
|
2012 |
14,494,000 |
|
2013 |
15,592,000 |
|
2014 |
16,516,000 |
|
2015 |
17,472,000 |
|
2016 |
17,559,000 |
|
2017 |
17,231,000 |
|
2018 |
17,312,000 |
|
2019 |
17,059,000 |
|
2020 |
14,555,000 |
|
2021 |
15,016,000 |
|
2022 |
13,782,000 |
|
2023 |
15,500,000 |
But what share does each truck have in the yearly car sales in the US? Let's see
Ford F-Series, Ram Trucks, and Chevy Silverado altogether have a significant share of the new car market in the US:
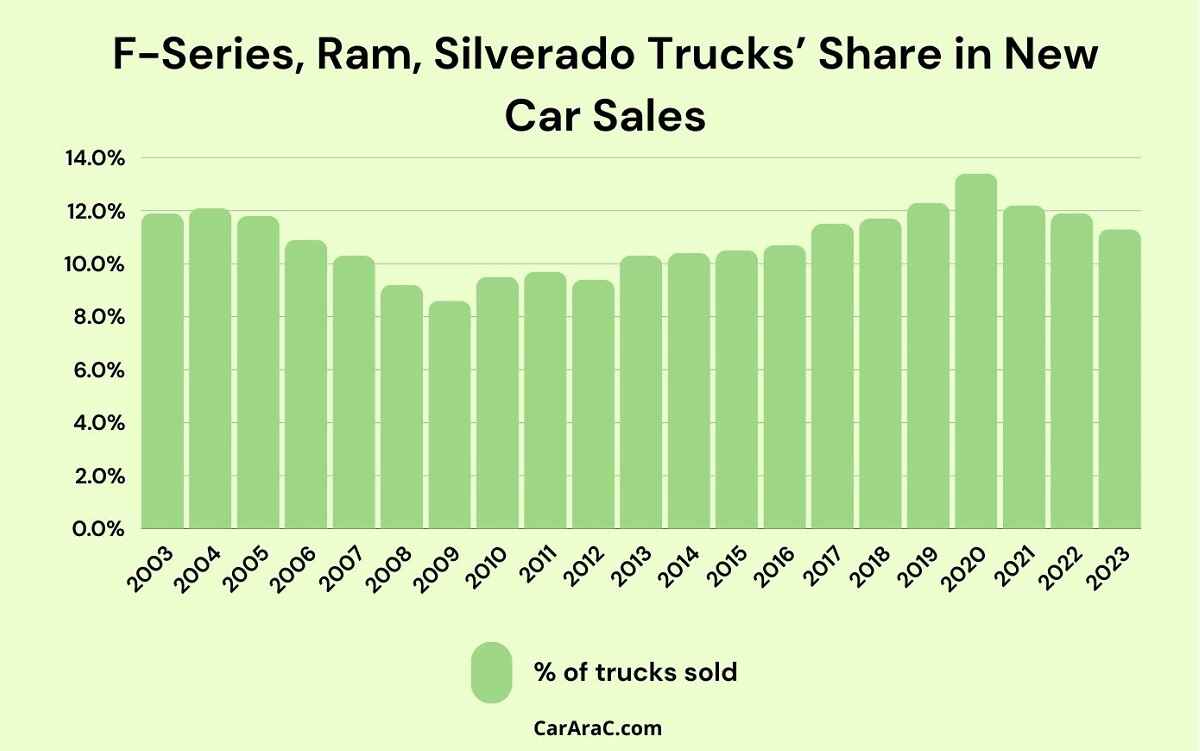
Astonishingly, these three truck models formed, on average 10.9% of ALL new car sales in the US, within the 2003-2023 time frame.
The peak year was 2020 when 13.6 of all US buyers bought one of these three trucks. The worst year was 2009 with 8.6% of all car sales being these three trucks.
4.82% of all new cars sold in the US between 2003 and 2023 were Ford F-Series trucks.
2.66% of all new cars sold within this period were Ram Pickup trucks.
3.54% of all new car sales within the recent 20 years were Chevy Silverado trucks.
About the authors
The CarAraC research team is composed of seasoned auto mechanics and automotive industry professionals, including individuals with advanced degrees and certifications in their field. Our team members boast prestigious credentials, reflecting their extensive knowledge and skills. These qualifications include: IMI: Institute of the Motor Industry, ASE-Certified Master Automobile Technicians; Coventry University, Graduate of MA in Automotive Journalism; Politecnico di Torino, Italy, MS Automotive Engineering; Ss. Cyril and Methodius University in Skopje, Mechanical University in Skopje; TOC Automotive College; DHA Suffa University, Department of Mechanical Engineering


Add comment